Q. What do you get when you deliver customer services over a network that combines GPON, DSL, LTE and a stack of other network technologies?
A. A service assurance nightmare!!
Every operator claims high availability. Five-nines (99.999% uptime) just never seems to be enough – but in reality, it’s dubious whether it’s even achievable.
This is where your network and service assurance framework can prove it – although it might be aided by the right exclusions, attribution logic and customer-facing transparency approach.
Here’s how the best telcos are tackling (and measuring) the immensely challenging and diverse world of network and service availability.
.
Before designing KPIs (Key Performance Indicators) or service-level metrics, it’s crucial to define what’s actually being assured: the physical network, or the services that run across it. Each scope has its own set of assumptions, stakeholders and impact zones – and clarity here affects everything downstream.
Network assurance (or what I personally refer to as “Nodal” Assurance – as in, each of the nodes/components in the network): focuses on physical infrastructure uptime. This could include device availability, port availability, link-level performance, device health and topology integrity. It answers the question: Is the network technically up?
Service assurance (or what I refer to as E2E Assurance, as in, the end-to-end experience of the customer / service): focuses on the customer experience. This includes real or perceived outages, degradation events, combinatory effects, or access failures even when the underlying network appears healthy. It answers the question: Is the customer able to use the service they’re paying for?
The two are not interchangeable:
A GPON OLT might be “up” (network assurance) while the downstream ONTs from it are powered down (service disruption). [Note: we will discuss scenarios where powered-down ONTs might be discounted from calculations later]
A core router could fail over cleanly, showing full redundancy success in network terms – yet some customers might still experience dropped sessions or degraded performance (a service-level impact)
.
When it comes to assurance and what we need to measure / manage, it all starts with the customer (as almost all OSS/BSS design should). More specifically, it starts with what the network operator is promising to deliver to the customer:
Customer Promise – The operator’s public or contractual commitment (e.g. “99.99% uptime for business broadband”)
Product Promise – How this commitment is translated into SLAs (Service Level Agreements), QoS (Quality of Service) guarantees and availability metrics
Service Design – The architecture and procedures required to fulfil the product promise, including MTBF targets, response times and redundancy levels
Each level must inform the layers beneath it. A vague or undefined customer promise leads to disconnected KPIs, lack of transparency around customer expectations and a challenge for operational teams to know exactly what their obligations are.
.
Operators must differentiate between:
Internal-facing metrics used for planning, engineering and NOC operations (e.g. port-level uptime, network MTBF). These are generally the raw, unmanipulated numbers – the brutal reality. These are generally network assurance or “nodal” measures described earlier, because it’s typically much easier to collect metrics from each device. Service assurance or “E2E” measures are still used, but often less commonly because these are often derived values and/or much harder to calculate
Customer-facing metrics used for SLAs, transparency and regulatory reporting (e.g. Customer Impact Hours, service availability %, ticket-based resolution times). These often incorporate exclusions (such as force majeure events), which is acceptable, as long as there is transparency for customers. These are typically more E2E or Service Assurance in nature
These exclusions, or fault attribution models (more on these later), are often drawn from regulatory rules or offer documents and may incorporate rules such as:
Intentional Outages – Uptime excludes planned outages such as scheduled maintenance
Events Outside the Operator’s Control – Excludes uncontrollable events such as force majeure, power outages not caused by the operator (eg customer impacted outages like the customer powering down the ONT in its premises), third-party facility failures, etc
Different types of networks (eg Satellite and non-Satellite networks) often have distinct availability calculations
Downtime is segmented into intentional vs uncontrollable vs actual impact – giving a granular model for internal ops teams and standardised logic for customer-facing reports
However, operators still record a total of all downtime without these exclusions as it helps to identify where changes / improvements might be needed.
.
AVAILABILITY = (TOTAL_TIME – DOWNTIME) / TOTAL_TIME
for example, in a given year, there are 8,760 hours, so for example, if a device is down for 5 hours in a year then the availability is:
(8760 – 5)/8760 = 99.943% availability.
As the table below suggests, five-nines is only around 5 minutes of downtime in an entire year.
| Days / Year | Hours / Year | Mins / Year | ||
| Five Nines | 99.999% | 0.00365 | 0.0876 | 5.26 |
| Four Nines | 99.990% | 0.0365 | 0.876 | 52.56 |
| Three Nines | 99.900% | 0.365 | 8.76 | 525.6 |
| Two Nines | 99.000% | 3.65 | 87.6 | 5,256 |
.
But availability isn’t the only metric that matters. It’s not just about “how long the network was down” – it’s about who was impacted and for how long. That’s where Customer Impacted Hours (CIH) provides clarity:
CIH = CUSTOMERS × IMPACT_HOURS
number of customers × duration of impact (note that if there’s more than one outage then this formula relates to the sum of customers × impacts)
Average Customer Availability = 1 – (CIH / (CUSTOMERS × 8,760)
This creates a bridge between network uptime and customer service reliability
For example:
If 100,000 customers were impacted for a total of 8,760 hours (an average of 5.26 minutes per customer per year), the customer-level availability is 99.999% (five-nines) but the granularity of CIH allows targetted investment in the most frequently impacted service areas.
.
To make service assurance measurable, it should be segmented by service type, domain or delivery model:
Access technologies: DSL, GPON, HFC, LTE, Fixed Wireless, etc.
Service tiers: best effort vs premium SLA-backed vs managed endpoint
Customer cohorts: residential vs enterprise vs wholesale
Service chains: single vs multi-vendor, single- vs multi-domain
Each domain may require unique KPI targets and fault attribution rules. For example, the NBN separates its GEO satellite-based services from fixed access in its availability calculations due to the environmental and operational complexity.
.
Availability isn’t a single KPI – it’s a system-level outcome shaped by architecture, hardware reliability, and the logical design of services. To move beyond vague “nodal” uptime percentages, operators need a structured approach that calculates true end-to-end service availability, grounded in platform MTBFs, failure domain modelling and redundancy configurations.
The previous definition of availability above was actual recorded availability. However, when designing the network to accommodate the promises made to customers, we need to calculate the predicted availability first and engineer the network’s resilience measures around that.
Predicted Availability is classically defined as:
Availability = MTBF / (MTBF + MTTR)
MTBF (Mean Time Between Failures) represents the expected operational lifespan between service-impacting failures
MTTR (Mean Time to Repair) is the average time it takes to restore service after a failure is detected
When availability needs to be expressed as a percentage over time, you can use:
Availability (%) = (Total Time – Downtime) / Total Time × 100
These calculations must be repeated across each domain of the service path to calculate the full system’s availability
.
In complex networks, availability must be computed across a chain of components
Serial logic applies when components have no failover – failure of any one results in service loss
Formula: A_total = A1 × A2 × A3 … An
Parallel logic applies when redundant systems are deployed
Formula: A_total = 1 – [(1 – A1) × (1 – A2)]
This parallel logic reflects high-availability designs like:
Dual BNGs (Dual-homed or redundant BNG [Broadband Network Gateways, a critical component in FTTx networks] designs allow failover and parallel path availability)
Fibre rings (A key architectural pattern in telco transport and access networks, designed to provide path-level redundancy)
Redundant path routing
Mixing serial and parallel models allows operators to mirror actual service design, especially across heterogeneous networks
Availability must be calculated not just per platform, but per end-to-end service chain
For example:
A broadband service might traverse: ONT – OLT – Aggregation Router – BNG – Core Router – Internet Exchange
Each platform’s MTBF and MTTR is calculated
Redundancy (if present) is factored into any parallel sections
To do this effectively:
Use topology-aware inventory systems (e.g. CMDBs) or network design patterns to map service paths
Associate MTBF values to each logical and physical node
Adjust for failover logic where it exists
This transforms assurance from a set of abstract KPIs into a model that mirrors real-world behaviour
.
Different access technologies have different baseline availability characteristics due to their physical mediums, power dependencies and resilience features
FTTP/GPON – typically high availability, especially with OLT redundancy and fibre loops
DSL/FTTN – lower MTBF due to copper degradation and environmental factors
HFC – vulnerable to localised noise and shared media congestion
Fixed Wireless – variable based on RF conditions, tower availability and power supply
Satellite – more affected by uncontrollable events like weather and gateway dependency
Model availability per technology domain and avoid averaging across fundamentally different platforms.
.
Availability estimates are more credible when validated by real-world fault records, such as:
Number of SEV1 and SEV2 tickets per platform
Duration of faults from open to close
Customer-impact footprint per incident
This allows operators to move beyond theoretical MTBF values and adjust models based on empirical field performance.
.
Uptime metrics can mask the true impact of a service failure. For example:
A 10-minute outage on a low-use DSLAM impacts fewer users than a 2-minute core router failure that drops traffic for 200,000 customers
To address this, track:
Customer Impact Hours (CIH) = # affected users × duration of outage
Availability weighted by customer impact scope, not just time
This aligns technical calculations with business and experience-level outcomes.
.
Standardising your availability calculation window ensures comparability and regulatory alignment. Common intervals include:
15-minute granularity (for performance correlation)
Daily or monthly summaries (for SLA tracking)
Annualised availability (for public or strategic reporting)
Use consistent rules:
Only count downtime after fault clock start
Exclude periods based on valid attribution rules (planned maintenance, uncontrollable events)
.
Calculating service availability isn’t just about measuring when something goes down – it’s about defining whether that downtime should count against your performance metrics. The fairness and credibility of any assurance model hinges on a transparent, repeatable attribution framework that answers a deceptively simple question:
Was the operator at fault – or not?
A well-defined attribution model draws boundaries between:
Customer-induced issues
Planned work
Force majeure
True operator-side failures
This step shows how to apply those rules consistently and embed them into your operational processes.
A “fault clock start” is the point in time when an operator begins officially counting the duration of a service-affecting incident for the purpose of:
SLA enforcement
Regulatory compliance
Availability or downtime reporting
Root cause analysis and operational accountability
It’s a crucial concept in service assurance, because how and when you start counting an outage directly affects reported metrics like:
Uptime percentage
Mean Time to Repair (MTTR)
Customer Impact Hours (CIH)
SLA breach determination
Let’s say a customer experiences a service issue, but:
They don’t report it for several hours
The NOC sees an alarm but isn’t sure it’s service-affecting
The issue clears before anyone logs a ticket
When do you start counting the outage?
That’s where each operator’s fault clock start policy comes in.
There is no global standard – operators typically define this based on service class, regulatory pressure, and operational policy.
Here are a few common approaches:
1. Customer-Reported Trigger
The clock starts only when the customer raises a ticket
Often used for best-effort services like residential broadband
Benefits: avoids over-counting outages customers never noticed
Risks: underestimates actual availability impact
2. System-Detected Trigger
The clock starts when monitoring systems or alarms detect a service-affecting fault
Often used for managed or enterprise services
Requires solid telemetry, alarm correlation, and fault isolation
Closer to real-time visibility
3. Hybrid Model
The clock starts at the earlier of ticket open time or alarm detection
May also include grace periods or validation workflows
Used for premium services with customer-facing SLAs
.
Likewise, the fault clock stop is triggered when:
The service is fully restored (confirmed by telemetry or ticket closure)
A workaround is implemented that restores service to acceptable levels
The customer confirms resolution (in some SLA-driven models)
.
When defining your fault clock policy, consider:
Service Class
Premium or SLA-backed services may demand earlier fault clock start times
Detection Capabilities
If you have poor telemetry or no CPE visibility, you may need to rely on tickets
CIOs and Exclusions
If the issue is caused by a Customer-Induced Outage (CIO), do you:
Start the clock and then stop it upon RCA?
Never start it because the root cause absolves the operator?
Dispute Management
Clear, documented fault clock rules help reduce billing and SLA disputes
.
Many industry frameworks agree that certain events should be excluded from downtime calculations – if specific criteria are met
Common exclusion types:
Planned Maintenance
Downtime is pre-notified to the customer (e.g. 48 hours in advance)
Falls within agreed maintenance windows
No SLA penalties apply if rollback plans exist and thresholds are not exceeded
Force Majeure Events
Natural disasters, civil unrest, widespread power failures, or upstream dependencies
Must be clearly logged, timestamped and justified
Customer-Induced Outages (CIOs)
ONT powered off, CPE misconfiguration, customer maintenance
Must be provable using TR-069, SNMP, logs or telemetry
RCA should clearly show that the root cause originated on the customer side
Fairness is built on consistency. Create a policy that clearly outlines:
Which types of faults start the fault clock
How attribution is assigned (customer, operator, force majeure)
When downtime is excluded from SLA calculations
Who is responsible for making and reviewing these decisions
Best practice – use tagging or classification in your ticketing platform (e.g. “CIO”, “Planned”, “Regulatory Excluded”, “Operator Fault”) and tie these tags to reporting logic
You can’t exclude downtime just because it’s inconvenient. It requires transparency with the customer from the service definition / contract that they sign up to. However, it does still require the ability to build evidence requirements into your attribution model:
CIO Exclusions – requires logs showing power loss, CPE reboot, customer action
Planned Maintenance – requires notification timestamp, affected list, rollback steps
Force Majeure – must cite external documentation (e.g. weather alerts, power utility notices)
This ensures transparency during disputes and supports your reputation with regulators, enterprise clients and account teams
Not all services need the same level of rigour. Define different attribution models for:
Best-effort services (e.g. residential broadband)
Ticket-based fault clock start
CIOs easily excluded
SLAs often not contractual
Premium services with SLAs
Early fault clock start (e.g. from alarm or test failure)
Manual or automated RCA required
Exclusions must be reviewed and logged
The tighter the SLA, the more robust and auditable your attribution logic must be
Grey zones happen – for example:
Power outage at a site shared between operator and customer
CPE fault that also triggered a line card reset
Simultaneous upstream and access issues
To handle these fairly:
Define an attribution dispute workflow
Use an internal assurance review board to adjudicate tough cases
Maintain a record of override decisions for future consistency
.
Manual attribution doesn’t scale – especially across thousands of tickets and alarms per month. Build attribution into:
Your fault correlation platform
Ticketing workflows (automated tags based on root cause)
Planned event calendars
Telemetry pipelines that detect ONT/CPE state changes
Automation not only saves time – it ensures repeatable logic for audit, reporting and SLA compliance.
.
Remember: Root Cause Analysis (RCA) and attribution are related – but they’re not the same.
RCA asks: What technically caused the issue
Attribution asks: Who is accountable for the downtime in SLA or availability terms
Some faults have shared causality – but in assurance models, one party must be assigned ownership for metric purposes
.
KPIs are the lifeblood of any assurance model – but too many operators either overcomplicate them with academic standards or oversimplify them into meaningless dashboard numbers. The key is to choose KPIs that are measurable, meaningful and aligned with how services are actually delivered
This step helps you select and structure KPIs using well-established standards, while making them usable in hybrid, multi-vendor, multi-technology environments
Most service assurance KPIs fall into a few functional categories:
Availability – is the network or service reachable and operational
Accessibility – can a user start a session (e.g. login, attach, establish call)
Retainability – once started, does the service persist successfully
Integrity – does the service maintain expected performance levels (e.g. speed, latency)
Mobility – for mobile services, are handovers seamless and non-disruptive
These categories can apply across technologies – fixed, mobile, hybrid, business, consumer
Several global bodies define KPI standards. Rather than reinvent the wheel, map your assurance model to the relevant subset of these:
ITU-T Y.1564 – frame loss, delay, jitter, throughput, availability (Ethernet service activation)
ITU-T Y.1731 – OAM for Ethernet fault and performance monitoring
ETSI TS 132.451 – KPI definitions for LTE/UMTS networks (accessibility, retainability, integrity)
GSMA IR.42 – QoS parameters for mobile networks (voice, SMS, data)
GSMA IR.81 – roaming quality and monitoring models
These provide both definitions and formulas – e.g. FLR = Frames Lost / Frames Sent
Use these as your baseline, then adapt for local context or access-specific requirements
No single KPI set works for every technology. Define KPI bundles for each service type:
GPON and FTTP
Throughput (down/up), session success, ONT uptime
OLT availability, ONU registration success
Delay/jitter if used for voice/IPTV
DSL/FTTN
Sync rate vs expected speed, session success, retrain counts
DSLAM port uptime, copper fault frequency
Mobile (LTE/5G)
Attach success, handover success, call drop rate
Average latency, cell availability, throughput per UE
RRC connection setup time
Roaming
IR.81: CSSR, PDP success, data session retainability, mean throughput
Delay in DNS resolution, Diameter response times
Match KPIs to the service class and technology limitations, rather than applying generic metrics across the board
Multi-vendor networks often suffer from inconsistent KPI logic. For example:
Vendor A defines “session drop” based on RADIUS timeout
Vendor B defines it based on DSL retrain
Vendor C doesn’t track it at all
To ensure consistency:
Build a common KPI dictionary
Enforce KPI mapping at the assurance platform or data collector level
Normalise vendor-specific counters into cross-domain metrics
This avoids “apples-to-oranges” comparisons and enables reliable benchmarking
Choose KPI reporting intervals that align with both:
The fault and performance detection window
The SLA or regulatory reporting cadence
Common windows:
5 or 15 minutes – for correlation with fault or usage spikes
Hourly/Daily – for trend and incident detection
Monthly/Quarterly – for SLA reviews or customer reports
Ensure that:
KPI snapshots match your incident timelines
Measurement boundaries (e.g. midnight cut-offs) are clearly defined
Don’t rely solely on what devices report. Build a combination of:
Passive KPIs
Logs, SNMP counters, flow data, alarm events
No customer impact, but limited by vendor instrumentation
Active KPIs
Test probes (e.g. HTTP pings, DNS, SIP), synthetic traffic, real-time checks
Useful for visibility in the absence of faults or tickets
Hybrid approaches ensure visibility even in silent failures, and support proactive detection
A common mistake is surfacing too many KPIs at once. Prioritise relevance based on:
The service class (enterprise vs residential)
The target audience (NOC, execs, customers)
The decision needed (is this breach-worthy, trend-worthy, or just noise)
Structure reports to focus on violations, anomalies and impact – not just static graphs
.
Service assurance doesn’t deliver value in isolation. To be meaningful, it must be embedded across the systems that operate, monitor, ticket, and monetise network services. This step focuses on how to integrate your assurance framework into the core platforms that drive operational continuity and customer experience.
When done right, metrics don’t just live on dashboards – they power alarm suppression, SLA compliance tracking, capacity planning, churn reduction and closed-loop automation.
Assurance only works if you know which infrastructure supports each service. This is where Service Impact Analysis (SIA) engines tied to network inventory solutions are so important in your OSS stack.
Use a dynamic inventory system to link:
Access nodes to subscribers
VLANs to service tiers
Logical paths to physical ports or links
Update inventory dynamically from:
Network discovery tools
Provisioning workflows
Orchestration platforms
This ensures that availability, performance and fault impact are correctly mapped to customer-facing services.
.
Assurance platforms should receive, correlate and act on:
SNMP traps and syslogs from network devices
Telemetry from access gear (e.g. ONTs, CPE, DSLAMs)
Alarms from transport and core networks
Key capabilities to enable:
Fault correlation – group related alarms across domains or layers
Root cause identification – isolate the triggering event from symptom cascades
Service impact tagging – flag which customers or services are affected
This enables faster triage, smarter ticketing and reduced NOC noise.
.
The connection between assurance and ticketing is crucial – this is where theory meets operational reality
Automatically raise tickets when:
KPI thresholds are breached
Fault clocks start based on event detection
Active tests fail for critical services
Pre-fill tickets with:
Service ID
Platform and fault domain
Customer impact scope
Attribution tag (CIO, Planned, Operator)
Link resolution data (from field teams, NOC, auto-remediation tools) back to:
Fault closure times
MTTR calculation
Customer Impact Hours (CIH)
This builds a complete chain from detection to resolution, supporting both SLA tracking and RCA.
.
SLA logic should consume assurance inputs to:
Track real-time SLA compliance by customer or service class
Generate violation reports automatically
Trigger escalations or credits based on breach logic
Examples:
If fault clock > 4 hours for Gold service – open escalation
.
Different roles need different views of assurance data. Tailor reports by persona:
NOC / Ops Teams
Live faults, open tickets, service-level impact
MTTR trends and platform reliability
Product / Service Managers
SLA conformance by service class
Repeat offenders by region or technology
Executives
Uptime by market segment
Improvement metrics over time
.
As networks modernise and AIOps solutions become progressively more advanced, assurance data can trigger:
This moves assurance from observational to intent-driven, reducing manual overhead and improving resilience.
.
Assurance data shouldn’t stop at the network edge (inward-facing perspectives) but assist with customer-facing actions as well, including:
Contact centre tools – to show which customers are impacted right now
CRM systems – to log availability breaches or trends on a per customer basis or other cohorts
Account management portals – to provide self-service SLA reports
This closes the loop between infrastructure, service experience and customer perception
.
For many operators, service assurance is a black box – only a handful of engineers understand how metrics are defined, what counts as downtime or how SLAs are measured. But for customers and stakeholders to trust your metrics, you need transparency by design and contract.
This means exposing not just the outcomes, but the rules, exclusions and reasoning behind them – in language customers and account teams can understand. When metrics are visible and defensible, they become a competitive differentiator, not just a compliance or contractual requirement.
The following are some hints to strengthen your Service / Network Assurance Framework as a differentiator.
Operators track many internal metrics that may not make sense to end users. Clarify which KPIs are:
For engineering use only (e.g. port-level uptime, internal path MTBF)
For operational use (e.g. SEV trends, MTTR, alarm counts)
For customer-facing communication (e.g. service availability %, CIH, SLA breaches)
Make sure internal and external views are mapped but not conflated, to avoid disputes and misunderstandings.
.
Every customer report should include a definitions section that:
Explains each metric in plain language
Clarifies measurement windows (eg 24/7 monthly vs business hours)
Shows how exclusions (eg planned, CIO, force majeure) are applied
Provides example calculations where appropriate
This reduces confusion and builds confidence in the process. It also reduces the effort expended by your team on disputes.
.
As described earlier, customers should never be surprised by how availability was calculated. Provide a transparent high-level summary of:
What events are counted vs excluded
How CIOs are identified
When the fault clock starts and stops
What supporting evidence (tickets, telemetry) is required
You don’t have to expose every line of code – but you should explain the logic and fairness model behind your attribution.
.
Give customers access to:
Availability stats over time (by service, region, etc.)
Active and resolved incidents
SLA compliance summaries
Downtime attribution (eg operator, planned, customer)
Dashboards should be designed to:
Answer common customer questions
Show patterns (not just single events)
Be exportable for auditing or internal reviews
Where possible, include self-service tools so customers can:
Query their own metrics
Raise SLA challenges with context
Download usage and downtime logs
.
Even with great transparency, disputes will happen. Build reporting that:
Links SLA violations to ticket IDs, timestamps and impact data
Stores RCA results and attribution tags
Flags cases where SLA logic was overridden by exception process
This allows you to defend SLA metrics in:
Contractual SLA reviews
Regulator inquiries
Account management meetings
.
In highly competitive markets, transparency can be a powerful value-add. Operators that provide:
Real-time service visibility
Explainable downtime
Evidence-backed reporting
…are more likely to retain enterprise customers, avoid SLA disputes and build long-term trust.
This is especially true for:
Government contracts
Managed service agreements
Regulated wholesale environments
Transparency isn’t just operational – it provides competitive / commercial leverage.
Service assurance depends on the quality, completeness and credibility of the data collected. That data typically comes from two main sources: passive monitoring and active testing. Each approach offers unique strengths and limitations, and leading operators use both in tandem to gain full visibility into network and service performance.
Passive monitoring refers to the collection of performance and fault data that’s generated during normal network operations. As a result, it tends to be more complete. This includes SNMP counters, syslogs, alarm traps, flow records, and telemetry collected through protocols like TR-069 or TR-369.
These methods are efficient and non-intrusive, making them ideal for establishing baseline network health, monitoring device-level reliability, and supporting long-term trend analysis. However, passive methods rely entirely on what the infrastructure is capable of reporting.
If a CPE, ONT or intermediate device has limited instrumentation, or if telemetry is disabled or fails, visibility can be compromised. Passive metrics are also less effective in detecting silent degradations—instances where service quality drops below expected levels without triggering a fault or customer complaint.
In contrast, active monitoring involves intentionally generating traffic or synthetic tests to simulate customer usage and measure real-time service quality of adjacent services.
Because additional infrastructure is required, these active probes are often only set up with one probe per network segment (eg agg ring, POI, etc). This means they don’t provide as significant coverage and only show an indicative service experience, not the service experience of any actual customers.
The active tests can include ICMP pings, HTTP GET requests, DNS resolution checks, or synthetic voice and video tests. More sophisticated examples include ITU-T Y.1731-based tests for Ethernet services, which assess frame delay, jitter, loss and end-to-end availability using standardised OAM mechanisms.
Active methods are powerful because they allow operators to see what the customer sees (albeit an indicative customer), even if no alarms have been raised and no faults have been logged. They’re especially valuable in multi-domain or multi-vendor environments, where passive correlation is limited, or in scenarios where services traverse unmanaged segments like internet exchanges or OTT partner networks.
The best service assurance strategies combine both approaches. Passive methods are ideal for wide-scale observability across the entire network and for building historical reliability baselines. Active testing, on the other hand, is essential for detecting intermittent issues, validating SLA commitments, and confirming service restoration in real time. For example, an operator might use TR-069 to pull performance telemetry from managed CPE devices, while simultaneously using active HTTP and ping probes to validate reachability of key services. On an Ethernet backhaul circuit, Y.1731 might run continuously in the background, while the assurance platform cross-checks results against SNMP counters and alarm history to confirm integrity.
Integrating active and passive inputs also improves the accuracy of fault attribution. For instance, if passive monitoring shows a healthy link but synthetic DNS probes consistently fail, the assurance platform may trigger a fault clock start even before a customer raises a ticket. Conversely, active success alongside passive alarms may help confirm a false positive or justify SLA exclusions. In either case, dual-layer visibility ensures that the assurance system reflects true service experience, not just device behaviour.
As networks become more dynamic, disaggregated and customer-centric, with more advanced blue/green release strategies, the case for active testing grows stronger. Used wisely, synthetic tests don’t just confirm uptime – they prove availability in a way that customers and regulators can trust.
.
A good assurance model tells you what happened
A great assurance model helps you get better
Whilst five-nines might be a commonly cited target, the reality is that every operator’s environment is different, so there’s no global target. Instead, whatever metrics you’ve gathered in the past, your true success in network/service assurance is continued improvement.
However, this can be asymptotic (diminishing returns) in nature. It’s easier to improve when coming from a low initial resilience level than when you’ve already had years of refined improvements. Yet continual improvement is still the target, and not just through gaming the metrics (eg changing attribution logic / exclusions), but by ongoing improvement activities.
This final step is about using the metrics, attribution logic and platform integrations you’ve already built to continuously refine operations, improve service reliability and reduce customer impact over time. True assurance maturity isn’t measured by uptime – it’s measured by how quickly you adapt, recover and improve.
In many cases, it’s about getting more granular or more specific with what you measure and manage.
Raw availability percentages (e.g. 99.95%) are useful, but they don’t show how you’re evolving. As just a tiny fraction of examples, start tracking:
Customer Impact Hours (CIH)
Number of affected customers × duration of fault
Weighted availability scores that reflect customer scope
Recurring fault domains
Repeat outages on the same DSLAM, ring, OLT, node, device type, batch of equipment, etc
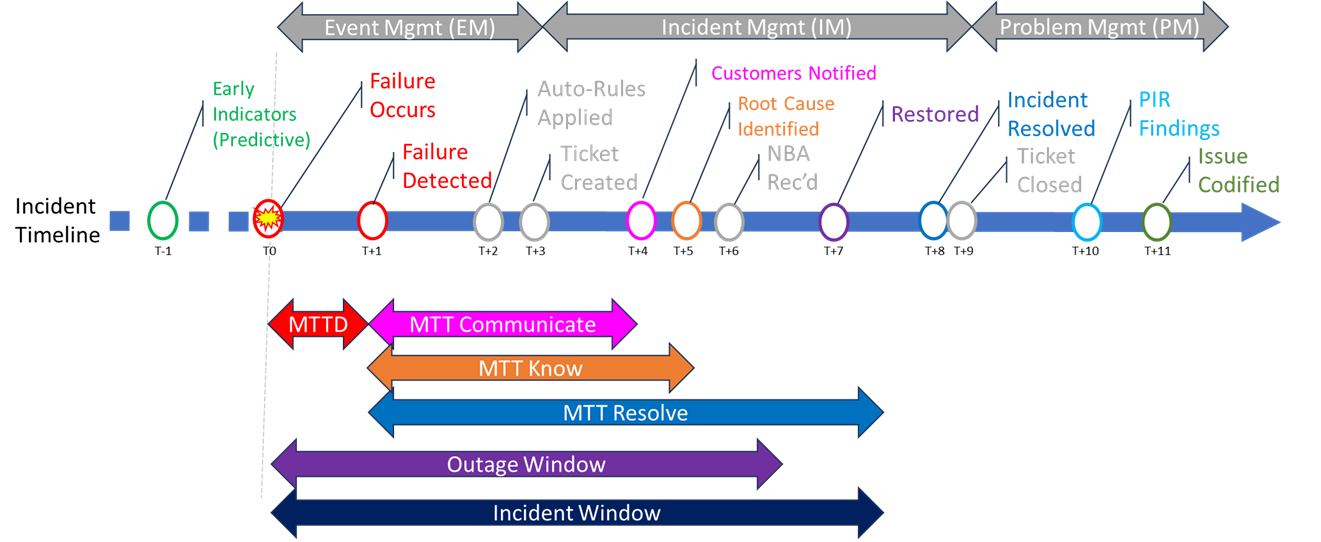
Service types or regions with higher MTTR
Mean Time to Detect (MTTD)
Time between fault occurrence and detection
Critical for identifying monitoring gaps
Mean Time to Acknowledge (MTTA)
Time from detection to ticket creation or NOC response
Reveals operational bottlenecks
Mean Time to Resolve (MTTR)
Time from acknowledgement to resolution
Benchmarked across platforms and teams
These metrics go beyond “was it up” and show how fast you react and recover. These may require more advanced solutions or faster response mechanisms from your assurance / AIOps / Observability solutions.
Once you have good observability and historical trends, layer in:
Anomaly detection based on past failure patterns
Predictive fault modelling using telemetry and ML
Automated remediation workflows for known issue signatures
Intent-based monitoring – e.g. “Keep latency under 10 ms on Tier 1 paths”
This shifts assurance from “measure the past” to “protect the future”
.
This guide presented a seven-step framework that enables operators to build a complete, standards-aligned, and customer-facing network and service assurance model. Starting with a clear distinction between network and service assurance, the framework walks through availability modelling using MTBFs and redundancy logic, defines consistent and defensible fault attribution rules, and aligns KPI selection with ITU, ETSI and GSMA standards across technologies like GPON, DSL and LTE.
The framework goes further by embedding assurance into OSS and BSS workflows, delivering transparent SLA reporting to customers, and driving operational maturity through metrics like Customer Impact Hours, MTTR and RCA analysis. By transitioning from reactive monitoring to predictive, closed-loop assurance, operators can reduce customer impact, build internal accountability and use service assurance as both a performance management tool and a strategic business enabler.
.
Hat tip to Paul, Ray, Stevo, Deepak, Carolyn, Evan, Clayton and Tony for your inputs / insights into this article!
.
As you know already, each network and solution environment is unique, so it follows that each Network / Service Assurance challenge has it’s own unique drivers. They’re all complex, they’re all different. Hopefully the step-by-step guide shown above has helped you map out your Network / Service Assurance Framework.
If you’re seeking further assistance, we’d be delighted to assist.
To discuss ways you can optimise the effectiveness of your next OSS/BSS transformation, start with Step A and Request an Appointment.