

What an OSS/BSS Procurement Really Costs: The Numbers Might Surprise You
An OSS/BSS transformation often begins with excitement and urgency due to a desperate need for change. It also creates trepidation because the wrong decision could
The Iceberg of Ignorance, (shown in the diagram below) is a widely revered model of imperfect communication between the coalface and the boardroom in large organisations.
However, in telecommunications, it bears a striking resemblance to our own OSS/BSS information collection frameworks, revealing a design flaw that impacts situational awareness.
And the only way to melt this iceberg is by combining OSS, BSS and multi-domain data analytics to deliver real insights wherever it’s needed, from coalface to boardroom.
In 1989, Sidney Yoshida supposedly* presented what became known as the Iceberg of Ignorance below.
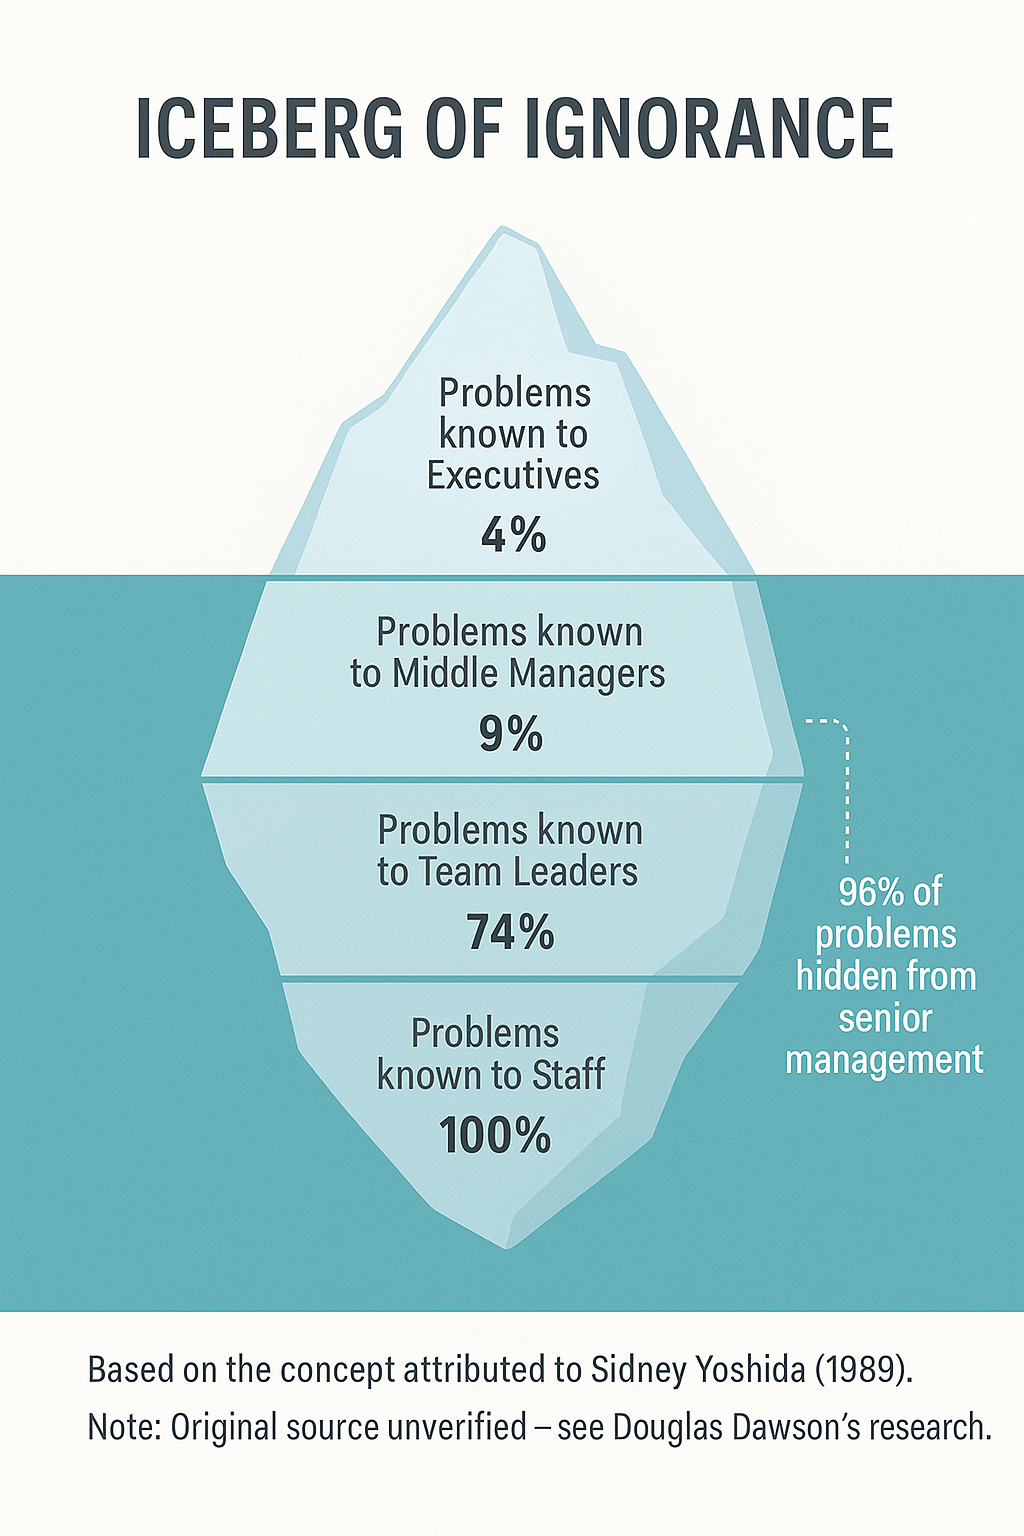
His study suggested that:
For decades, the metaphor has been cited in management presentations as evidence that reality becomes almost invisible the further it travels up the reporting chain. There’s certainly a strong element of truth to the concept, but the numbers are arguable (and undoubtedly vary from situation to situation).
.
In any large organisation, the volume of detail generated at the operational coalface is overwhelming. But does the Iceberg of Ignorance provide evidence that a company’s senior execs simply have no clues about what is happening at the coalface?
TLDR; This article disputes this (in part), but also provides a 7 step process for how to overcome the very real problem of communication within large organisations (and OSS/BSS stacks).
The reality is that frontline workers do see a level of detail that higher-ups couldn’t (and arguably shouldn’t) know.
Let’s take a look at just a single business unit within a large telco from the bottom of the iceberg up (ie inverting the iceberg):
As you can see, each layer loses fidelity. But if you multiply the amount of information (eg network health signals) by dozens/hundreds of business units, abstraction is clearly a necessity. Without it, leaders would drown in operational noise.
Despite what the Iceberg of Ignorance might imply, summarisation and abstraction are unavoidable tools to reduce this complexity to a level of detail suitable for each layer to efficiently act upon.
The problem with the Iceberg of Ignorance is that it doesn’t adequately show the breadth of coalface domains at the bottom of the iceberg. That’s why this article will argue that it’s better shown as a pyramid rather than an iceberg, but more on that later.
There are two trains of thought at play here:
Just as these trains of thought apply to corporate communications, there’s also a strong analogy to OSS/BSS/NMS, the data collection pipelines that underpin telco businesses.
.
As an industry, we’ve formalised abstraction through the Telecommunications Management Network (TMN) pyramid for decades. The TMN model defines layers from Element Management (EML) up through Network Management (NML) and Service Management (SML) to Business Management (BML).

Image courtesy of www.researchgate.net.
But if we mark-up the TMN pyramid, you’ll see that each layer abstracts data from the one below, but also connects / aggregates data from adjacent domains or data sets.

We could even draw parallels with the percentages used in the Iceberg of Ignorance:
It’s easy to lose the details of the trees when you’re only looking at the forest.
We’ll come back to the trees within the forest later on!
But first we’ll look at one of the challenges of abstraction that’s arising in our modern network architectures.
Network virtualisation (SDN/NFV) and 5G are currently generating large investments of time and money. They’re fundamental changes because they also change the shape of our traditional OSS/BSS/IT stacks, as follows.
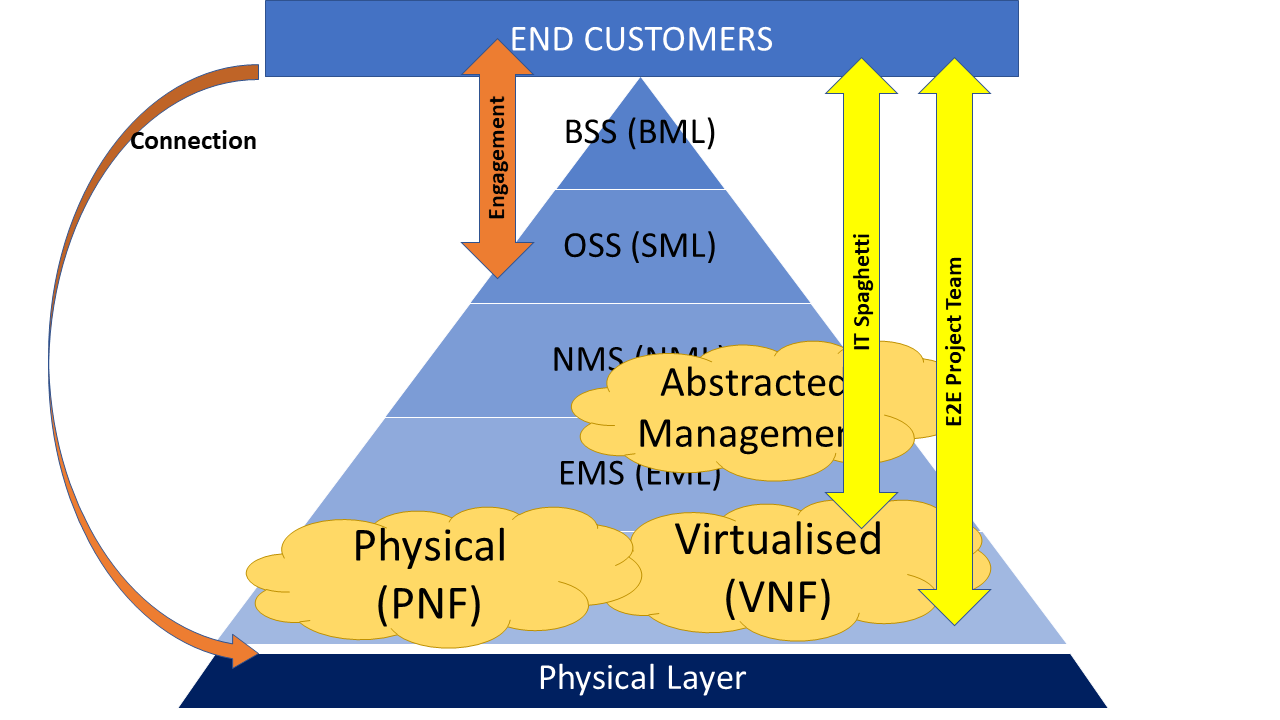
We now not only have Physical Network Functions (PNF) to manage, but Virtual Network Functions (VNF) as well. In fact it now becomes even more difficult because our IT stacks need to handle PNF and VNF concurrently. Each has their own nuances in terms of over-arching management.
The virtualisation of networks and application infrastructure means that our OSS see greater southbound abstraction. Greater southbound abstraction means we potentially lose E2E visibility of physical infrastructure. Yet when things go wrong, we still need to diagnose faults and manage E2E change to IT stacks to support new products, network types, etc.
Abstraction leads to the yellow areas of fogginess in the diagram above. 😀
.
Abstraction is not the only culprit in our information gaps.
Equally damaging is disconnected data domains.
OSS and BSS environments often evolve in silos. Assurance systems focus on monitoring the network. Provisioning systems focus on fulfilling customer orders. Billing and revenue systems operate somewhat independently of both. CRM platforms maintain their own records of customer interactions. ERP tools record device details, but with a financial rather than operational objective.
Whilst integrations are often the bane of the existence of OSS architects, they’re also important as a cross-linking mechanism. We have an important trade-off to consider:
In theory, integration frameworks and data warehouses are supposed to unify these perspectives. In practice, the burden of maintaining perfect synchronisation is challenging. Data models drift. Context gets lost in translation. Even within a single operator, different business units often operate as independent islands, each with partial and conflicting views. Data degrades. The diagram below, from a wonderful article from Nucleus Research, called Measuring the Half-Life of Data, indicates that the rate of decline in data value can be correlated to how it’s used, from tactical to strategic to operational.

This fragmentation and decay means that even the most sophisticated “single pane of glass” solutions rarely deliver true situational awareness.
.
One of the other problems with manual reporting lines is that the reports are only as accurate as the underlying data. When us humans get involved, we often present aggregate summaries of summaries (whether unintentionally or by conspiracy). They present averages and trend lines without preserving the granular, relational data that explains what is happening and why.
This is the 96% problem: the overwhelming majority of operational signals remain hidden or filtered / diluted before they ever reach decision-makers. Even when everyone acts in good faith, the structure of the data collection systems themselves conceals the most important evidence.
Single panes of glass are marketed as the ultimate solution for operational blindness. The promise is appealing: one dashboard to aggregate every system and every metric into a unified view.
.
To overcome this blindness, telcos have a powerful weapon in their arsenals. Yes, you guessed it. It’s their OSS/BSS stack! (no biases here – haha!)
OSS/BSS stacks allow operators to develop insights in two dimensions:
The diagram below gives a sense of all the corners of the compass for 5G networks alone (and yes, there are usually many other network domains in a typical telco network):

Most operators have partial visibility. They might have strong North/South observability within their 5G or transport networks. Alternatively, they might have effective East/West integration between billing and CRM. But without both dimensions, across all the layers in the stack above, working together, it remains impossible to answer critical questions like:
Complete situational awareness requires architectures capable of capturing, correlating and connecting all the dots, potentially in real time.
This is an impossible task for a human workforce to do. But with a cleverly stitched data, data fabric, compute and algorithms working for you, it might just become more viable.
.
Emerging data management approaches offer some promise though.
Graph databases provide a dynamic way to express relationships between entities anywhere in the knowledge graph presented above. Unlike traditional relational models, graphs can naturally capture the interdependencies between virtual resources, physical devices, customers, services, resources and business processes.
When combined with AI-driven correlation engines, these architectures can process vast volumes of data to identify patterns, connections, trends and root causes that would otherwise remain invisible to the typical human brain.
Data Platforms are continually improving to demonstrate how graph intelligence and AI can identify patterns that transform operations from reactive to predictive. They offer the promise of a model that bridges the gap across abstraction barriers.
.
While the technologies are promising, success depends on thoughtful design.
Here’s a 7-step roadmap for telcos seeking to melt the iceberg of ignorance:
As you’ll see in the PS below, the Iceberg of Ignorance may have uncertain origins, but its lessons remain relevant. Abstraction and summarisation are essential tools, but they come at the cost of visibility. In the complexity of modern telecommunications, this trade-off is no longer sustainable with old OSS/BSS thinking.
But by combining OSS and BSS with modern data processing such as data fabrics, graph models and AI-powered correlation, telcos can build architectures that see everything and connect everything, just waiting for anybody anywhere in the org chart to ask questions of the data. With the right frameworks in place, it’s not just the polished 4% of reality that survives to the boardroom. We can actually have an AI seat in the boardroom that can answer any question the board might have. Or perhaps even better, to bring important information to light that would’ve otherwise never even been discussed.
The operators who finally melt the iceberg and turn situational awareness into a competitive advantage are likely to build on the foundations established by OSS/BSS and the data platforms that underpin them.
.
I should also point out an important caveat. Douglas E. Dawson conducted a thorough investigation into the origins of Yoshida’s model and found no verifiable record. Not of the original symposium proceedings, nor formal documentation of the study. In his article Finding Sidney Yoshida, Dawson highlights that while the concept resonates powerfully, its evidence base is surprisingly thin.
Despite this, the Iceberg of Ignorance remains a useful metaphor for understanding the limits of communication in large enterprises, particularly those as complex as telecommunications providers.
