For the World Cup Final, will You replace Messi with a Local Club Player to lower wage costs?
Given the topical theme of the World Cup final, we’ll go with a soccer story today. For the World Cup final, do you think Argentina
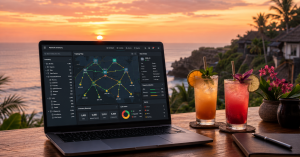
In our last article, we showed some examples of two exciting situation enrichment innovations, including the example below.

These examples have the ability to provide really exciting ways to inform and communicate across different persona groups.
Becoming more involved in AR/VR, digital twin and NFT / metaverse-style projects recently, I’m finding that there’s a lot of attention on the visual information. It really gets peoples’ attention. But I’m also finding there’s one really important distinction, one that’s rarely delivered upon in any of these other forums:
The wow-factor is in the graphics, but the value is in the (knowledge) graph.
Being able to tie these geo-spatial representations to the type of data stored in our OSS/BSS databases is what really moves the needle. We’ve linked these solutions with our sandpit OSS. This allows us to calculate and overlay information such as nearest connected device, utilisation status, customer IDs, root-cause of failures, service impact, hazard identification, contact information, etc, etc.
These use-cases are all enriched by the knowledge graph that are our OSS/BSS databases. Business cases will be driven by the graph… presented as an overlay on the graphics.
These examples are discussed in an upcoming report on Exciting Innovations in OSS/BSS that we’ll be releasing soon.

Given the topical theme of the World Cup final, we’ll go with a soccer story today. For the World Cup final, do you think Argentina
For decades, scale gave large telcos purchasing power, infrastructure reach, extensive capability and millions of customers. It became one of the world’s most powerful and
Success in business, distilled to its simplest form, is often about arbitrage. The gap between supply and demand. The gap between value delivered and value
When it comes to OSS, the term Out of the Box (or OOTB) can be correct, incorrect and highly confusing all at the same time.