


Are you climbing the corporate ladder or the value ladder?
Have you ever looked at the next rung of the corporate ladder and wondered whether that’s actually a job you’d want to do? When I

In February 2023, Cyclone Gabrielle cut every major fibre route into Hawke’s Bay and Gisborne. Bridges collapsed and took the cables with them, and roads slid off hillsides. For days afterwards, much of the region struggled to stay connected.
Most carriers would like to ask “what if?” before an event like that, not after. Which of our sites would be isolated? Which customers would we lose? Which of our “diverse” routes would turn out to fail together? It’s a question many want to answer and few can.
This article provides a walkthrough of a “what-if?” capability in the Personal OSS Sandpit Project: three real New Zealand outages, replayed on the sandpit’s network. It builds on my previous article on hidden single points of failure, which uses the inventory to find routes that look diverse but share a trench. It runs on the same two containers as that one – OpenNMS Horizon 36.0.4 watching the network and Kuwaiba v2.1.1 recording it – with the sandpit’s own Python app reading both over their APIs. Nothing new was installed for this.
There are four steps:
The table below shows the three events replayed in the sandpit’s Inventory tool, under Route risks: what was publicly reported, the fibres cut, and what the network would lose.
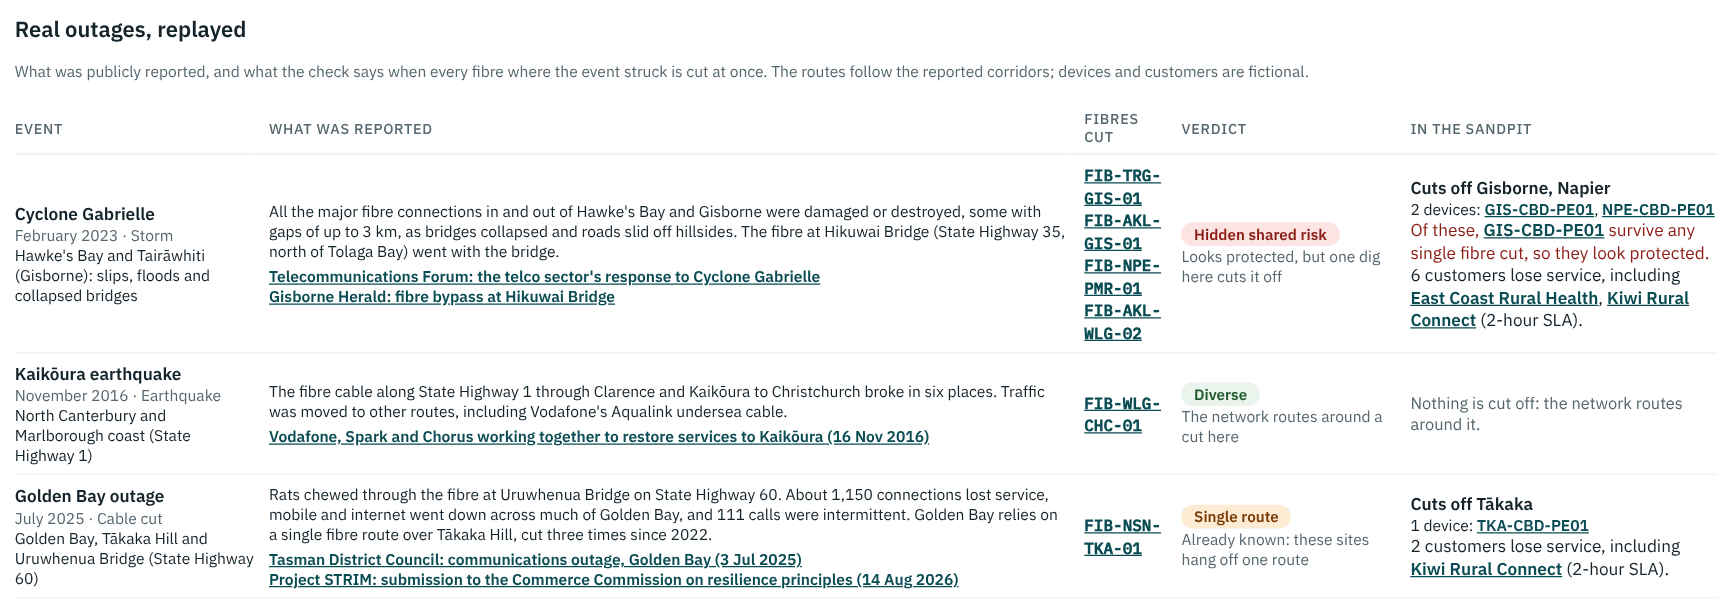
[Image: Real outages replayed: Cyclone Gabrielle, Kaik?ura earthquake and Golden Bay — to be added]
Trench layouts aren’t public, but outages often are. Three New Zealand events were chosen because each was publicly reported in enough detail to say which routes were hit:
Each event is a block in the sandpit’s network file: what it was, where it struck, which of our fibres run through that area, what was publicly reported, and links to the sources. The reported text is carried through to the screen, so whoever reads the result can see what the replay was built from:
events:
  - name: Cyclone Gabrielle
    date: "February 2023"
    kind: Storm
    area: "Hawke's Bay and Tair?whiti (Gisborne): slips, floods
           and collapsed bridges"
    fibres: [FIB-TRG-GIS-01, FIB-AKL-GIS-01,
             FIB-NPE-PMR-01, FIB-AKL-WLG-02]
    reported: >-
      All the major fibre connections in and out of Hawke's Bay
      and Gisborne were damaged or destroyed, some with gaps of
      up to 3 km, as bridges collapsed and roads slid off
      hillsides. The fibre at Hikuwai Bridge went with the bridge.
    sources:
      - {title: "Telecommunications Forum: the telco sector's
                 response to Cyclone Gabrielle", url: "..."}
Note: the events are not built in Kuwaiba. Kuwaiba holds the network as it is – sites, routers, fibres, trenches – and an event is a question asked of it, not a change to it. Three events, a hundred events, or one a planner types in this afternoon: nothing is written back, so nothing has to be cleaned up afterwards.
The sandpit’s New Zealand network gained two places for this: Gisborne and T?kaka. Those are built in Kuwaiba, the same way as everything else — a city, a building, an exchange, a router, and the fibres out of it — because they are part of the network, not part of a scenario. Their routes follow the corridors named in the reports:
Each fibre carries the road it follows, which is what lets an event be matched to it by hand:
- {name: FIB-AKL-GIS-01, a: GIS-CBD-PE01 xe-0/1/1,
   b: AKL-MDR-CR02 Te0/0/0/4, km: 690, side: east,
   route: "East Cape coast, Tolaga Bay, Hikuwai Bridge
           (State Highway 35), Whakat?ne, Rotorua"}
Here’s what that fibre looks like in Kuwaiba itself, port to port, with the equipment hierarchy nested around each end — the same Physical Path View trace used in the previous article:
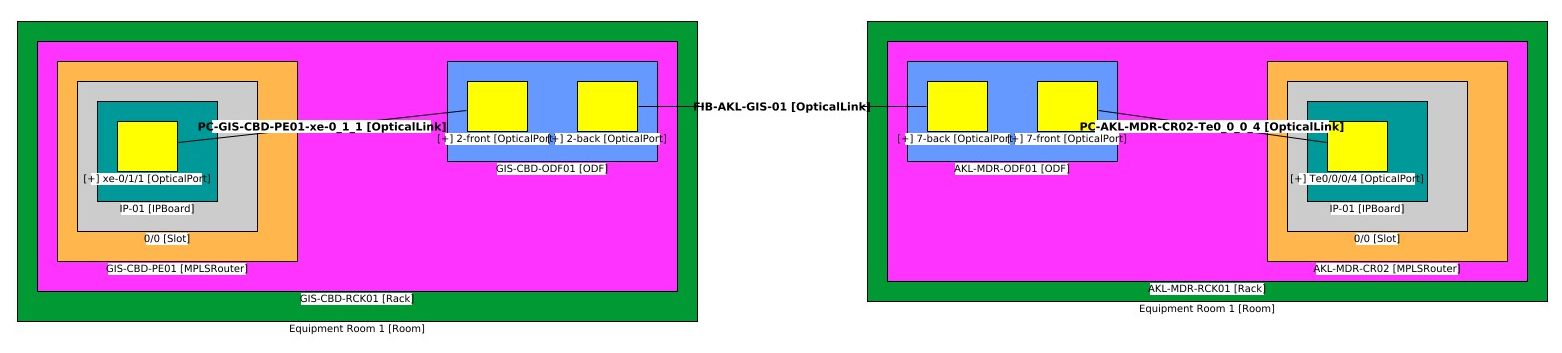
[Image: Kuwaiba’s Physical Path View tracing FIB-AKL-GIS-01 from Gisborne to Auckland — to be added]
Each event then lists the fibres that run where it struck. For Cyclone Gabrielle, that is both Gisborne routes, the Napier to Palmerston North route, and the east coast route through Hawke’s Bay.
Note: the routes follow public reports, but the exact fibre paths, devices and customers in the sandpit are modelled, because operators don’t publish them. An operator’s own route data is what would turn a replay into findings about their network.
The replay doesn’t need any new analysis. An event and a trench are the same shape of question — here is a set of fibres, cut them all — so the previous article’s check is handed the events instead of the trenches, and it is the same analyse() function, the same two passes and the same three verdicts. As before, that check runs in the sandpit’s Inventory tool, not in Kuwaiba: Kuwaiba supplies the fibres, sites and customers over SOAP, and the walk itself happens in the Python app:
# the trenches, exactly as in the previous article
out = risk.analyse(links, trenches, gateway, site_of,
                   customers_on, tight)
# and the real outages from the network file, same check
events = net.get("events", [])
replay = risk.analyse(links, events, gateway, site_of,
                      customers_on, tight)
out["events"] = replay["trenches"]
So an event gets a verdict for the same reason a trench does: the check works out who can no longer reach the gateway in Auckland, and whether those sites survive any single fibre cut. If they do, and the event takes them out anyway, it is a hidden shared risk.
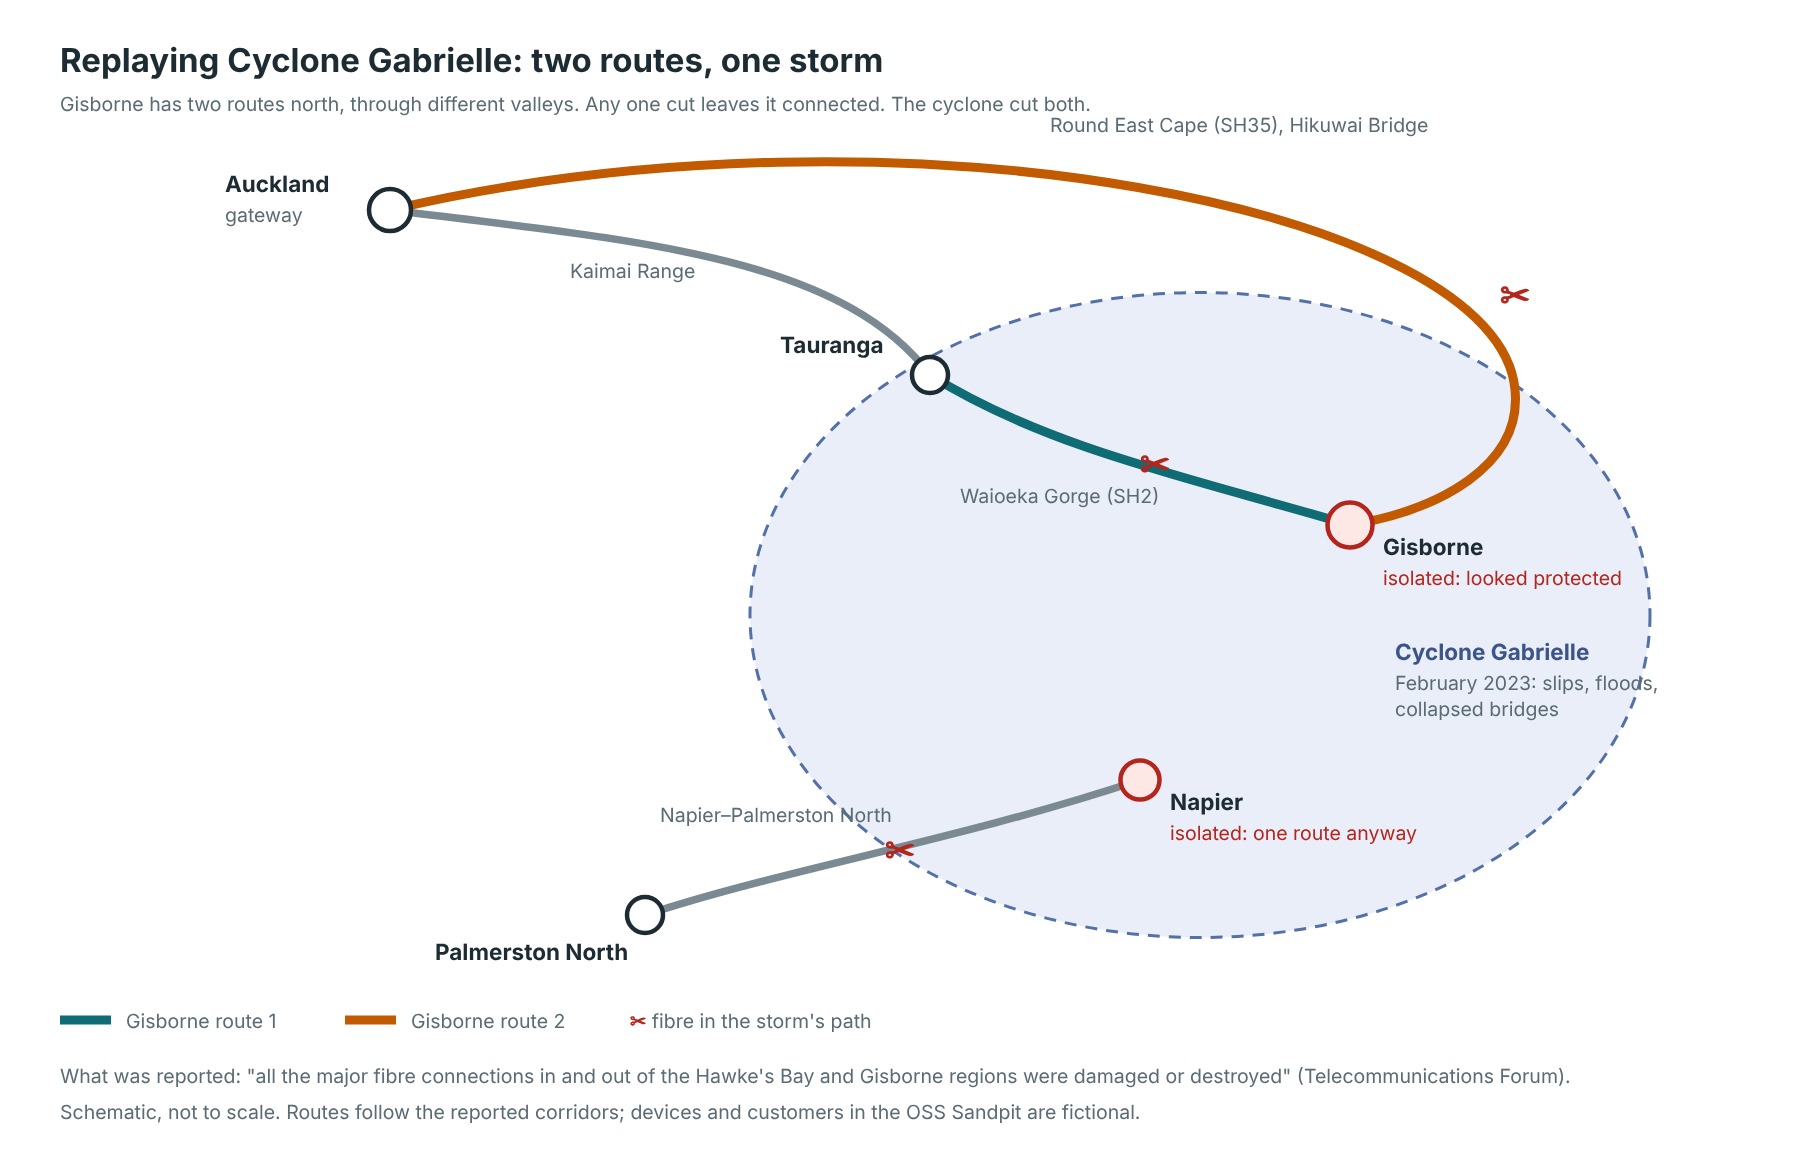
Cyclone Gabrielle is the interesting one. Gisborne has two routes in different valleys, so any single cut leaves it connected. The storm cut both.
[Image: Schematic of the Cyclone Gabrielle replay — to be added]
Note: my first layout had both of Gisborne’s routes ending in Tauranga, and the check marked Gisborne as a single route, not a protected one. The reason was that Tauranga itself has only one fibre out, over the Kaimai Range. Two routes into a town aren’t diverse if they meet somewhere with one way out. The check caught a mistake I hadn’t seen, which is exactly what it’s for.
| Event | What was reported | The sandpit’s replay |
|---|---|---|
| Cyclone Gabrielle | All major fibre into Hawke’s Bay and Gisborne damaged or destroyed | Hidden shared risk. Gisborne looked protected but is isolated, with Napier. Six customers lose service, two of them on 2-hour SLAs |
| Kaik?ura earthquake | State Highway 1 fibre broken in six places; traffic moved to other routes | Diverse. Christchurch keeps a route, so nothing is cut off |
| Golden Bay outage | Single route cut; about 1,150 connections lost; 111 intermittent | Single route. T?kaka is isolated: a known single point of failure |
The three results show three different situations. Golden Bay is a known single point of failure, and the local community group Project STRIM has raised it publicly with the Commerce Commission. Kaik?ura shows real diversity working, once traffic was rerouted. Gabrielle shows routes that were diverse on paper but shared one hazard: the storm. That last kind is the hardest to see in advance, because no single trench or fibre gives it away.
STRIM’s submission makes a further point worth repeating: “physical route diversity does not necessarily translate into service diversity”. A customer’s service only benefits from a second route if it is set up to use it.
The Assistant answers these questions too. Ask “What would Cyclone Gabrielle do to our network?” and it replies from the replay. It picks the event out of the question by matching the distinctive words in each event’s name — “gabrielle”, “kaikoura”, “golden bay” — against what was typed, then reads that event’s result and writes it out: the places isolated, which of them looked protected, and the customers on the tightest SLAs. No AI model is involved, and the same figures are on GET /api/inv/risks, where the replays come back as an events list beside the trenches.
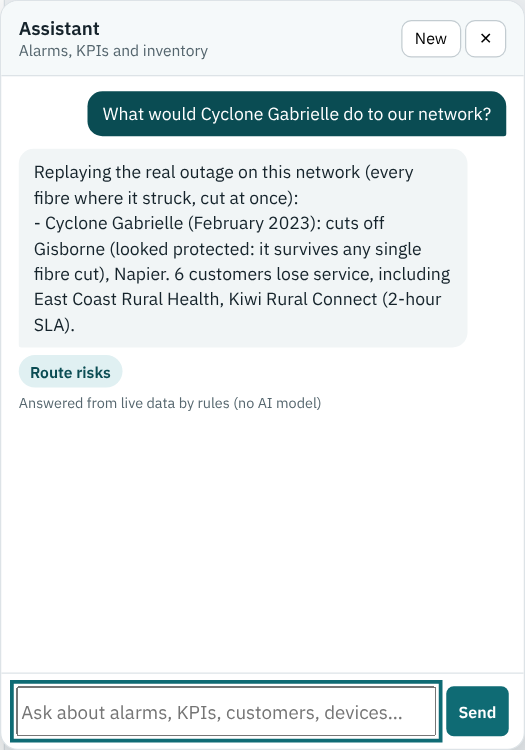
[Image: Assistant answering what Cyclone Gabrielle would do to the network — to be added]
The replay is a snapshot: every cut at once. Real events unfold over hours and days, as one route goes, then another, while crews restore a third. A play-through over time, and visualising these “what-if?” scenarios on the inventory’s maps, are natural next steps to explore.
This module adds “what-if?” analysis to the sandpit:
I hope you enjoyed this brief introduction to how we’ve replayed real outages on our Personal OSS Sandpit Project. Click on the link to step back to the parent page and see what other modules and use-cases are available for review, and see the previous article for how the single point of failure check works.
My thanks to Ryan for the sandpit and for naming this as one of the use-cases worth drawing out, to Charles Bedón for Kuwaiba, and to Craig Gallen, whose Kuwaiba–OpenNMS work this all builds on.
Which events would you replay on your own network? I’d love to hear about them in the comments below.

Have you ever looked at the next rung of the corporate ladder and wondered whether that’s actually a job you’d want to do? When I
OSS Sandpit – Hidden Single Points of Failure: Routes That Look Diverse but Aren’t Ask any network planner whether their important sites are protected and
Every NOC has lived this moment. The alarm list lights up, dozens of red rows appear at once, and the first question from the duty

Across this series, we’ve looked at fragmented AI investment, the rush to launch AI projects, the AI dependence on OSS and BSS, and the need