
The Data Quality Paradox: Everyone Pays for Bad Data, But Nobody Owns the Bill
Imagine an apartment building with a leaking pipe. Multiple apartment owners keep paying to repair damaged ceilings, carpets and walls. But nobody wants to fund


In his book Upstream: The Quest to Solve Problems Before They Happen, Dan Heath tells a fascinating story about homelessness in Rockford, Illinois.
For years, the city had struggled to reduce homelessness. Numerous organisations were involved, from police and healthcare providers to shelters, government agencies and social services.
Everyone was working hard. Everyone was discussing the problem. But meaningful progress remained elusive.
Then someone flipped the script completely. Instead of talking about the large, complex (daunting) problem at scale, they took a far more personalised view.
Rather than continuing to discuss homelessness as an abstract problem, Rockford’s team developed a real-time, by-name list of people experiencing homelessness.
Meetings stopped revolving around statistics and general policies. Instead, participants discussed individual people.
Where is Steve? Who saw Steve this week? Is he still living under the bridge? What housing is available? Who can help Steve move into it?
The conversations became specific, actionable and accountable. The participating organisations began coordinating around individual outcomes rather than their own organisational responsibilities.
In December 2015, Rockford achieved what is known as functional zero for veteran homelessness, meaning that its system had sufficient capacity to house more veterans than were becoming homeless. In January 2017, it achieved the same milestone for chronic homelessness.
Heath captures the underlying lesson in a phrase:
Macro starts with micro.
Can you see where this might be going if we put a telco lens on this concept?
Lots of people talk about the large, complex (daunting) problem of data quality. We have been for decades. We still haven’t got data errors down anywhere near functional zero yet have we?
.
Consider the same hypothetical person called Steve. But this time Steve is no longer homeless. He now has a home in Rockford and is excited about getting high-speed Internet services installed there.
Steve orders a new fibre service. The operator confirms the premises are serviceable and commits to an RFS (Ready for Service) date.
That date arrives…. and then disappears off into the distance. Still no service.
Steve calls his service provider. The contact centre sees a delayed order. The fulfilment team sees a blocked workflow. The network inventory team believes capacity is unavailable. The field technician believes the fibre infrastructure is already installed.
Perhaps they don’t even care because they’re measuring their performance against the macro, not the micro?
That’s where we’re going to explore a different approach to data integrity in this article.
.
Telcos have understood the importance of network topology for decades. In network assurance, a topology helps us understand which physical and logical resources depend on one another.
Network topology is the cornerstone of preparing:
But have you ever stopped to consider that operational data has a topology too? Or the implications of what we might do with it?
A customer record relates to an account. An account relates to services. Services relate to orders and resources. Resources relate to network elements, sites, locations and connectivity. Orders depend on tasks, workflows and decisions made by other systems.
Just as there’s a network knowledge graph, there’s also a data knowledge graph.
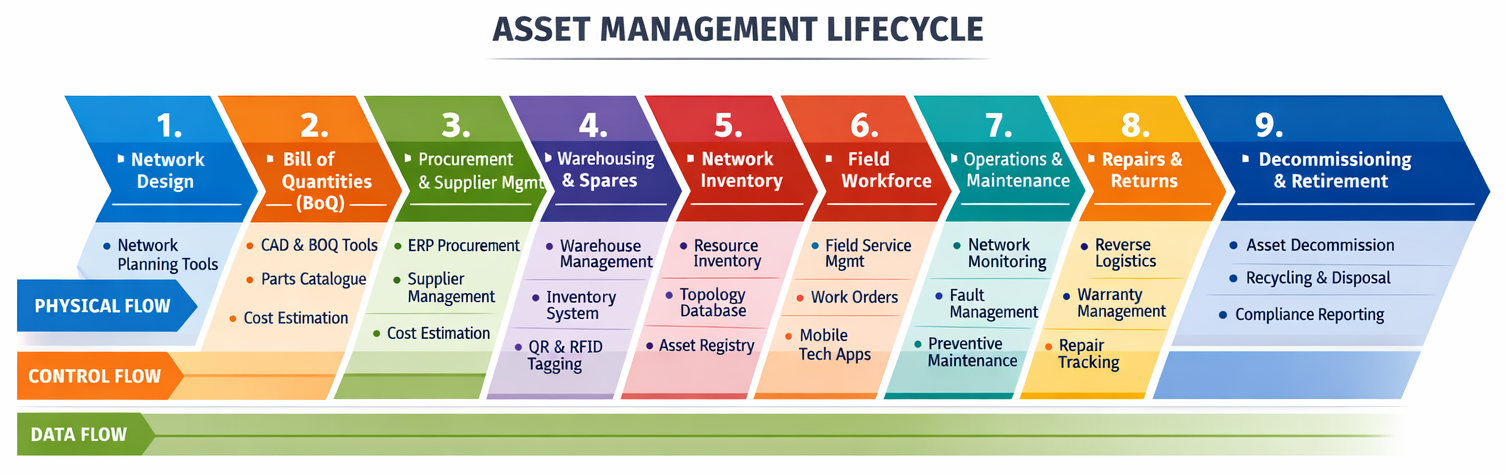
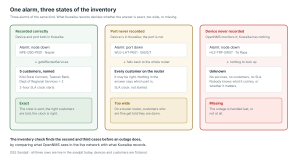
And every one of those relationships has its own data sources, identifiers, timestamps, confidence levels and potentially conflicting representations (as per the example in the diagram below).
One router, touched by multiple different people, in multiple different systems, and with a high likelihood of no single end-to-end tracking ID.
A data topology is a connected model of operational entities, their relationships, their provenance and the dependencies that determine how data influences business processes.
It potentially combines three interconnected perspectives:
Add a fourth dimension, time, and we can reconstruct what the operator believed at a particular point, not merely what its systems say today.
The result is an operational dependency graph that can be traversed in multiple directions (more on that below).
With a well maintained dependency graph, we now have a chance of getting micro on Steve’s RFS problem. We just need to walk the graph.
.
Imagine Steve’s service order was blocked because the inventory system incorrectly showed available access-network capacity. We traverse towards the network from Steve’s house.
Our investigation might reveal the following hypothetical chain of events.
In this situation, Root-cause diagnosis sounds easy in theory for amateur network sleuths like us. However in practice, it’s much harder to piece together remotely… especially when nobody has end-to-end responsibility for connecting these dots.
.
This is where the knowledge graph gets particularly powerful. Once we’ve identified the underlying defect, why stop with Steve?
How many other customers are potentially affected by the same issue of bad data quality at that joint? What if fibres 01 or 02 were dead and every other subsequent customer connection was pushed out by 2 fibres?
This time, we can start at the network where Steve had the defective resource reservation and traverse the graph forwards towards other (potentially impacted) customers.
This might discover:
This is the data equivalent of service impact analysis.
We can even potentially identify the likely blast radius of a data defect.
Instead of investigating one missed RFS date, we might discover an entire class of problems to solve.
And rather than fixing them only after customers complain, we can identify the remaining cases proactively.
RCA walks backwards towards the cause (network).
SIA walks forwards towards the consequences (customers/services).
The same data topology enables both.
.
This visibility is one of the capabilities of the Data Integrity Control Tower described in our Data Foundations framework.
The Control Tower continuously collects, correlates, evaluates, ranks and visualises evidence about data integrity across operational domains.
It needs to understand more than whether individual fields are populated correctly.
It needs to detect inconsistencies between sources, missing or invalid relationships, stale information, conflicting identities and dependencies that cannot be trusted.
The Control Tower has moved from measuring abstract data quality to identifying evidence-backed operational consequences and prioritising rectification / remediation effort.
Why should a thousand low-impact formatting errors necessarily outrank one stale record that prevents multiple customer services from being activated?
The answer is that they shouldn’t.
.
Detection and visualisation are only half the problem.
The next question is familiar from Rockford.
Who’s going to help Steve?
A data integrity platform can identify hundreds of problems. But unless someone owns the investigation, coordinates the necessary teams and verifies the outcome, we have simply created a more sophisticated backlog.
That’s the role of the Data Operations Centre (DOC).
Think of the DOC as applying the operational discipline of a Network Operations Centre to data faults.
The Control Tower identifies, correlates and explains suspicious data conditions. The DOC coordinates their investigation and resolution.
For Steve, that might mean:
The DOC also maintains the relationship between the originating defect, affected customers, remediation tasks and verified outcomes.
Importantly, the DOC doesn’t necessarily need its own comprehensive ticketing and workforce-management platforms.
For operators already using ITSM, workflow orchestration or work-order-management systems, the DOC can integrate with those tools. A native case-management capability can serve organisations without equivalent infrastructure.
The intelligence and coordination functions should be modular rather than forcing another wholesale platform replacement.
Responsibility for correcting records should remain with the accountable source and process owners that actually have context to know what the data really means.
.
There’s another implication here.
Traditional data-quality programmes often report metrics such as completeness, consistency, accuracy and freshness.
Those measures remain valuable. But for an executive sponsor, they are intermediate indicators rather than the ultimate outcome.
Consider two very different management reports.
Report A:
“Network inventory completeness improved from 94% to 97%.”
Report B:
“We identified the data defect that delayed Steve’s service, corrected the underlying cancellation workflow and found the other orders exposed to the same issue before their RFS dates. The estimated cost recovery of fixing this recurring fault type is $123,456 per year”
Which one better communicates business value?
The second connects data integrity directly to customer outcomes, delayed revenue, operational costs and preventable rework.
And that creates the foundations for a stronger business case.
The financial impact of a data defect can extend well beyond the cost of correcting a record. It can include repeat investigations, unnecessary field activities, delayed billing, missed service commitments, customer compensation and potentially lost customers.
But those costs need to be attributed carefully to avoid counting the same consequences multiple times.
Instead of simply estimating the cost of poor data in aggregate, we can progressively trace particular data faults to particular operational and financial consequences.
That gives executives numbers that are more tangible to evaluate and fund and derive a measurable return against.
.
This architecture doesn’t necessarily require us to centralise all operational data into a single graph database.
Indeed, attempting to replace every source of truth with one enormous master database could reproduce many of the problems we’re trying to solve.
A federated approach can maintain governed identities, relationships and references while leaving authoritative information in the systems responsible for it (eg NMS for different network domains).
The graph might combine network inventory, GIS, discovery, service orchestration, CRM, assurance and other operational sources.
Each entity and relationship should retain information about its origin, authority, validity period and confidence.
This is important because confidence, accuracy and authority are not the same thing.
A discovery tool might be highly confident about what it observed at a network port without being authoritative about whether that port is legitimately reserved for a future customer.
Likewise, two systems may use different identifiers for the same customer, location or resource (like the asset lifecycle diagram above). The graph needs to preserve those aliases and explain why records have been linked.
Even the relationships / associations themselves can be wrong and need continual testing.
An inferred service-to-resource connection must not automatically be treated as a proven dependency. Otherwise, RCA and SIA could produce convincing but incorrect answers.
A useful data topology therefore needs traceable evidence, relationship-level confidence, temporal context and well-defined rules for when information can be trusted.
.
So far, we’ve used the graph to investigate a missed RFS date.
But the more interesting opportunity is to intervene before hearing the whooshing sound a missed RFS date makes as it disappears off into the distance.
Imagine the Control Tower continuously checking orders approaching their committed RFS dates (ie approaching Jeopardy states).
It predictively detects that Steve’s order is not just about to go into a jeopardy state, but can determine that it’s being blocked by a questionable reservation.
The DOC automatically creates or updates a case, assigns the appropriate team and coordinates an investigation. Steve never needs to call the contact centre.
This is the transition from reactive data cleansing to continuous data integrity assurance.
It’s also an important prerequisite for AI-driven operations and Autonomous Networking.
AI agents can potentially accelerate investigation by proposing graph traversals, correlating events and suggesting likely causes. But unless their conclusions can be traced back to trustworthy evidence and verified relationships, they risk automating the very mistakes we’re trying to eliminate.
.
A practical pilot doesn’t have to begin by modelling an entire telecommunications network.
Start with ten customers whose orders missed their RFS dates.
For each customer, try to reconstruct the end-to-end dependencies that determined the outcome.
Which data records influenced the fulfilment process? Which systems supplied them? Which relationships were missing or contradictory? Which decision actually blocked progress?
Then work backwards to the originating defect and forwards to find other customers potentially affected.
These repeated patterns reveal where fixing a single upstream process could prevent hundreds of downstream problems.
Build the data topology around real business questions, expanding it as new dependencies and domains become relevant.
.
The most memorable part of the Rockford story came from changing the question.
Instead of discussing homelessness as an abstract, overwhelmingly complicated problem, people started discussing Steves.
They surrounded the individual problem with the organisations, evidence and actions needed to resolve it.
Telecommunications operators face a remarkably similar challenge.
A Data Integrity Control Tower, supported by a DOC and an operational data topology, offers a way to surround those problems with evidence and accountability.
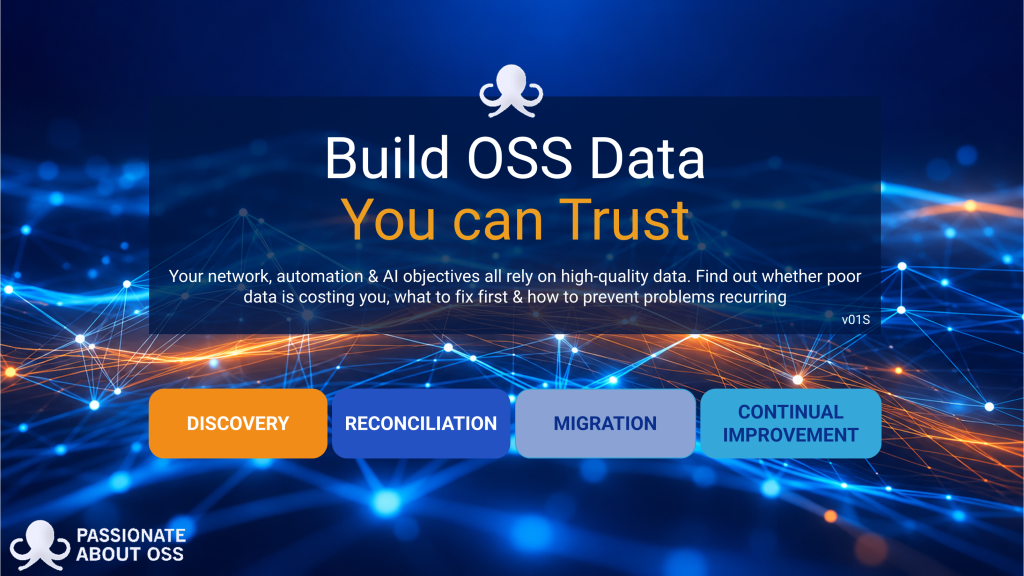
The CT + DOC concept is a key pillar in our free 94-page Build OSS Data You Can Trust guide explores the principles behind establishing trusted data foundations, including the Data Integrity Control Tower, Data Operations Centre, data reconciliation, provenance, confidence and sustainable operational improvement.
Click on the image to download the pack.
https://passionateaboutoss.com/product/data-foundations/

Imagine an apartment building with a leaking pipe. Multiple apartment owners keep paying to repair damaged ceilings, carpets and walls. But nobody wants to fund
OSS Sandpit – Inventory Enrichment: Finding the Gaps Before an Outage Does Every inventory is out of date somewhere. A switch goes in during a
Bad OSS data has been quietly draining BAU budgets for decades. But with AI, AIOps and Autonomous Networking (AN), we’re about to discover just how
Your telco knows enough about you to identify you (via KYC mechanisms), bill you, market to you and manage your services. But does it understand