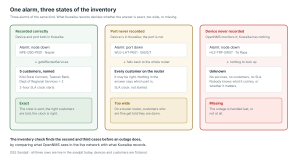
OSS Sandpit – Inventory Enrichment: Finding the Gaps Before an Outage Does
OSS Sandpit – Inventory Enrichment: Finding the Gaps Before an Outage Does Every inventory is out of date somewhere. A switch goes in during a


Imagine an apartment building with a leaking pipe. Multiple apartment owners keep paying to repair damaged ceilings, carpets and walls. But nobody wants to fund the plumbing repair, either because they don’t realise the cumulative damage or because it looks too expensive.
That’s the paradox facing telcos with bad OSS data. Everyone’s paying for the “minor” repairs in their apartment, but nobody realises there’s a broader impact on the quality of life on all apartment owners or has responsibility for adding up the combined bills.
Those with collective responsibility, telco executives / sponsors, are under pressure to reduce costs, accelerate transformation and improve customer experience.
Unfortunately, one of the biggest obstacles to achieving those outcomes is often hidden in plain sight, never fully appearing on their dashboards.
It’s the cumulative impact of unreliable OSS data, quietly absorbed as business-as-usual (BAU) inefficiencies by frontline teams and buried across multiple departmental budgets.
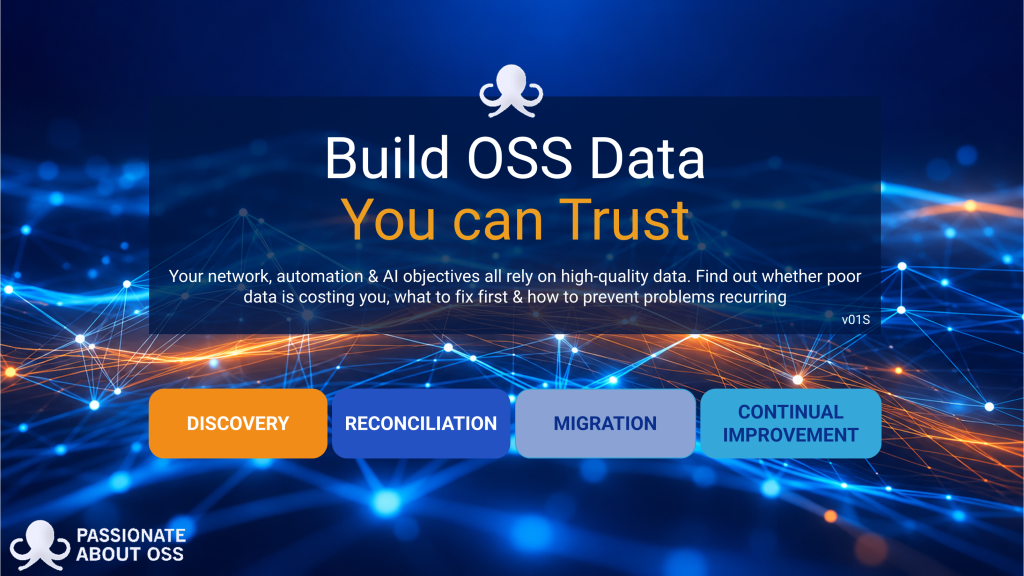
We’ve just launched our new, freely downloadable, 94-page interactive whitepaper, Build OSS Data You Can Trust to help resolve this problem.
.
Consider a technician changing a fibre connection in the physical network.
The change works perfectly. Traffic flows. The job is closed. But the corresponding update to the physical network inventory (PNI) is missed or recorded incorrectly.
Unlike active network equipment, passive infrastructure such as cables, splices, patch panels and fibre connectivity can’t generally be polled to confirm its actual configuration in real-time. That passive “data ping” requires someone to audit the infrastructure in the field.
The inventory depends on accurate as-built documentation, field verification and disciplined change processes.
As per the diagram below, data dependencies are built from the bottom-up. Almost every other layer of the OSS data environment builds upon these physical-layer relationships. Service inventory, resource availability, network planning, fault management and automation all depend on them higher up the layer-cake of a telco data stack.
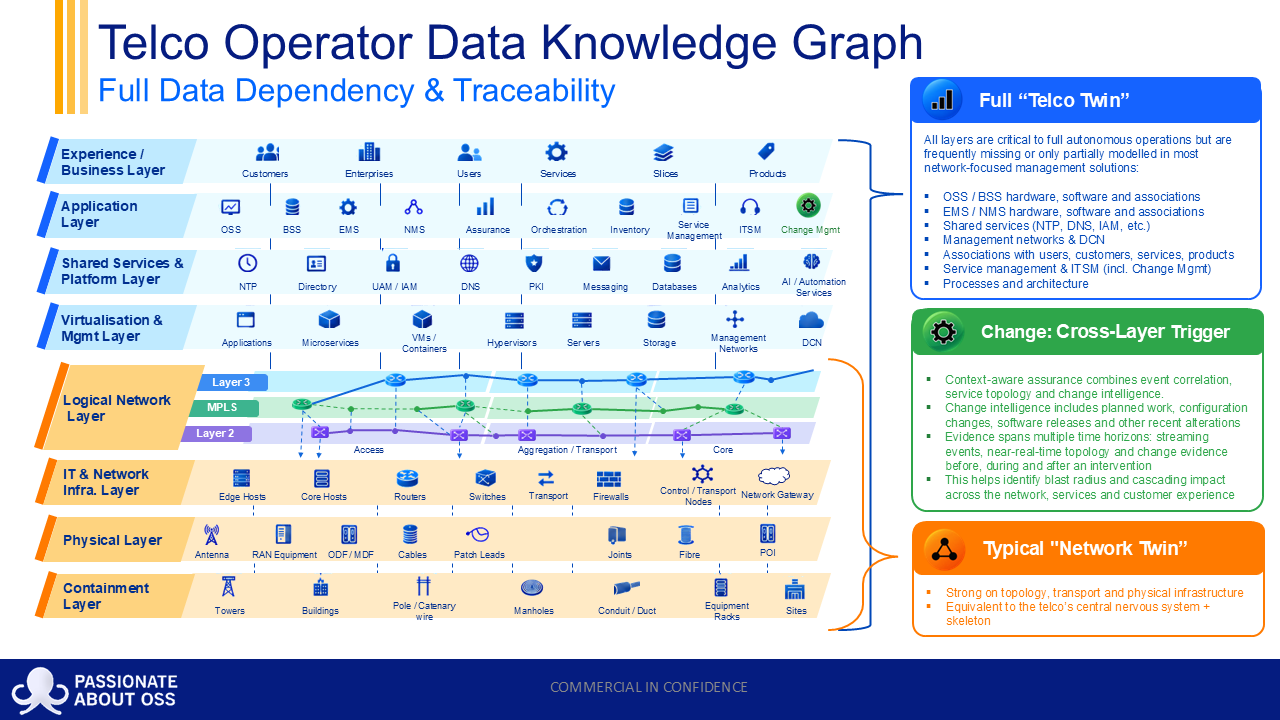
One incorrect physical connection might seem insignificant. But like the leaking pipe, it can cause damage far beyond where the original problem occurred.
.
Let’s follow the impacts of a single unrecorded fibre change.
Five teams. Five different symptoms. Five different budget lines. Five different financial impacts.
The original defect may never be identified as the common cause.
Luckily, operational teams have become quite adept at compensating for these problems through spreadsheets, manual reconciliations and specialist knowledge.
Their ingenuity keeps the business running. But it also helps hide the true cost of unreliable data.
As we look to build more autonomous systems, taking human compensation out of the loop, the cost of unreliable data could actually increase further.
.
Now, let’s go back to consider the ten pressures confronting telco executives in the first graphic above.
Cost reduction. Customer experience. Complexity. Revenue. Resilience. Speed. AI and automation. Workforce efficiency. Energy consumption. Competitive advantage.
Trusted data influences every one of them.
But it’s extremely rare for the dots to be connected back to data quality. Executives rarely see a dashboard showing how much poor physical inventory data (leaky pipe) contributes to operational waste, delayed services, degraded customer experience or stalled automation (repairs in each apartment).
Execs are more likely to see:
Each department manages its own improvements while the shared root-cause remains largely invisible and unquantified.
It’s like approving more money for carpet repairs, repainting and cleaning crews without recognising the leaking pipe connecting them all.
So, here lies the paradox.
Coal-face workers experience the impacts of poor data quality. Executives are accountable for those collective sub-optimal business outcomes. However, the whole organisation often lacks true visibility of the root-cause that would justify investment in fixing the coal-face problems.
.
Now, the question to ponder – What if we started calculating the true cost of recurring data defects instead of simply absorbing the impacts of inaccurate records?
Suppose poor physical network inventory causes 100 unnecessary truck rolls annually. At an illustrative fully loaded cost of US$400 per visit, that’s US$40,000 in avoidable field costs alone.
Now add design rework, manual reconciliation, order fallout, delayed revenue and other downstream consequences.
Suddenly, a seemingly minor data quality issue becomes a potentially significant investment opportunity.
This is why we developed the PAOSS Data Quality Contagion Cost Calculator (DQCCC).

The DQCCC helps identify primary and secondary cost impacts of physical network inventory defects, bringing scattered operational inefficiencies into a more coherent financial picture.
It provides a starting point for estimating the cost of doing nothing, identifying potentially avoidable expenditure and developing an ROI case that executive sponsors can understand and fund.
The aim isn’t to claim perfect accuracy. It’s to replace anecdotal frustration with a more defensible business case, using realistic assumptions and avoiding double-counting.
But quantifying the damage is only half the solution. We also need to fix the leaking pipe and prevent it recurring.
That’s where our new Build OSS Data You Can Trust pack comes in.
This interactive guide provides a practical six-stage methodology for discovering, modelling, correcting, controlling and continually improving OSS data.
Stop repeatedly funding the consequences of bad data. Start building the foundations that deliver better business outcomes.

OSS Sandpit – Inventory Enrichment: Finding the Gaps Before an Outage Does Every inventory is out of date somewhere. A switch goes in during a
Bad OSS data has been quietly draining BAU budgets for decades. But with AI, AIOps and Autonomous Networking (AN), we’re about to discover just how
Your telco knows enough about you to identify you (via KYC mechanisms), bill you, market to you and manage your services. But does it understand
OSS Sandpit – What-If Analysis: Replaying Real Outages on the Network In February 2023, Cyclone Gabrielle cut every major fibre route into Hawke’s Bay and