What an OSS/BSS Procurement Really Costs: The Numbers Might Surprise You
An OSS/BSS transformation often begins with excitement and urgency due to a desperate need for change. It also creates trepidation because the wrong decision could
When you’re planning your next-generation OSS/BSS roadmap, what’s guiding your decisions? Are you looking for and/or researching features that have never been seen before? Are you finding new problems to solve? That’s our (my) typical mindset isn’t it?
What if I instead pointed you to a little-known framework that looks deep into the past to help you to predict what’s most likely to be important in the future?
This article, part of a 5 part series, will do exactly that by introducing you to the Lindy Effect.
.
We’re currently in the process of buying another business (as described in this earlier article about not starting from scratch). This business has been around for many years, so it already has cashflows, product-market fit, etc. During the planning for this potential portfolio addition, I was reminded of the Lindy Effect. Whilst thinking about it, a few other OSS-related dots started to connect. Dots I hadn’t previously connected: the Lindy Effect, the long-tail feature curve, and our ongoing commitment to reduce complexity and friction in OSS/BSS (and telco more generally).
Once we overlaid those threads, an overarching product roadmap framework started to click into place. Interestingly, it’s a framework that looks quite different from the way the industry tends to do Roadmap Planning today. The rest of this series builds on these pieces, step by step, turning it into a practical playbook that we’ll share with you.
.
The Lindy Effect is a simple model. For non-perishable things such as ideas, books, companies, institutions, concepts, the longer they have lasted, the longer they are likely to last. In other words, time acts as both a filter and a predictor. If a concept has endured for 30 or 40 years, its future life expectancy is probably measured in decades, not months. If it’s already endured, it’s likely to continue enduring. A bit like this business acquisition we hope to close, which has been around for decades.
In OSS/BSS, Lindy doesn’t tell us to freeze the past. That would be dumb. Our tech stacks are proliferating in many different directions at speeds that are impossible to keep up with, so we can’t stand still.
Instead, it tells us to learn from, and prioritise, the past’s survivors. The functions that have proven durable across technology eras – compute (from mainframes to cloud), networking (from copper to fibre) and databases (from relational to a plethora today) – are likely to perpetuate further.
As we enter this period of dramatic AI progress, it can be overwhelming to wonder what the future might look like from here and make plans accordingly. How might we adapt to remain relevant? But against this fear of the unknown, Lindy suggests that if something has outlived multiple hype cycles, it’s likely to continue to endure. Not necessarily in an identical form, but very similar in function.
Even the term OSS itself. Since I wrote my first blog back in 2012, people have suggested I should change the domain name, predicting the demise of the term OSS. That continues to remain possible, but I still sense that at worst we’ll just go from big OSS to little oss (as described in this article from 2016 that still remains relevant).
.
Four OSS/BSS domains have stood the test of time. They were there 30-40 years ago and are likely to still exist in another 40 years:
Think of them as plots of land in desirable locations, whose value will never go away, even though the buildings on top are rebuilt repeatedly.

There’s no coincidence that these are the four arrows that sit on top of the Simplified TAM model either.
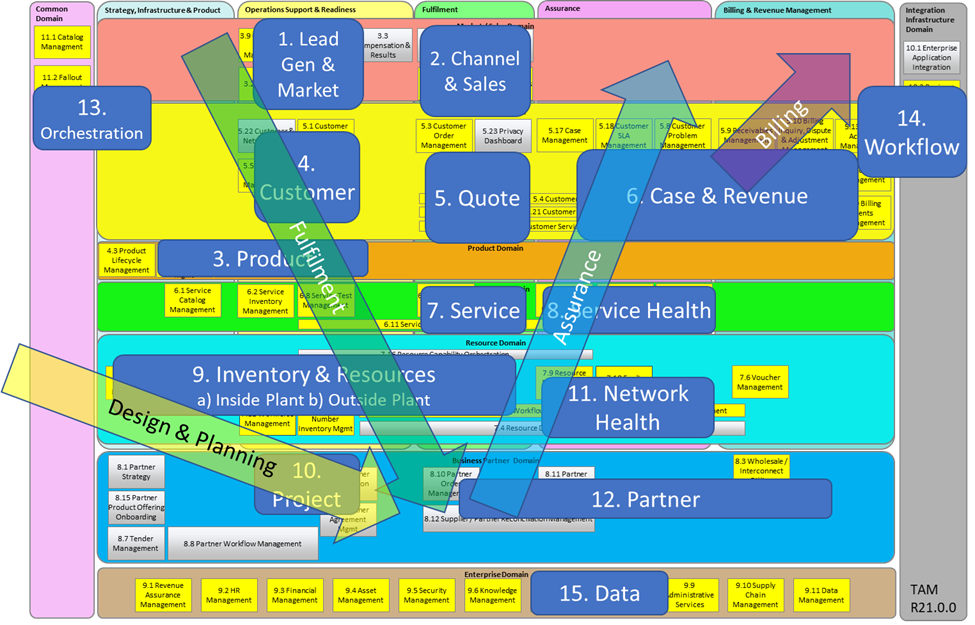
These are the Lindy-stable shapes of OSS/BSS (not to mention their dozens of associated perpetual use-cases).
As various technologies have advanced, implementations of these domains have continually evolved across architectures, data stores, orchestration layers, user interfaces and workflows but the purpose of each domain persists. This is where compounding lives. Reinvest in these four, and improvements cascade into KPIs that also endure: time-to-quote, time-to-cash, mean time to repair, right-first-time, revenue assurance, customer satisfaction. The list goes on (and the Lindy Effect ensures they go on and on and on).
.
The long tail diagram below is one of our most cited.

When designing a product roadmap, most backlogs naturally drift rightwards on the long tail (the blue arrow) because the red band already exists. Therefore, it’s in the blue arrow where we conceptualise features that have never been seen before and where we find new, niche problems to solve.
The red band is the Lindy functionality. It’s the core capability that has probably existed since the MVP version. That’s because it’s also the highest value functionality.
To make the long tail useful in practice:
.
Many programmes optimise for go-live. Day 1 after handover, where integration threads are tied off, workflows are aligned to today’s catalogue, reports are tuned to current KPIs. But systems start to decay on Day 2 as networks, products, and policies evolve. Moreover, the environment in which the systems live is also continually morphing.
When planning a roadmap, our minds typically go to Day 1. But these systems will need to last 5+ years, so we regularly take clients on a re-framing journey. This helps them to think about what their systems and environment will look like in 5-10 years.
It’s hard to predict the future. Nobody can do it reliably, but we do have three frameworks to call upon to help:
Designing for Year-10 durability requires accommodating change rather than having “baked in” capabilities:
The mindset shift is subtle but powerful: treat novelty and renovation as subservient to the enduring domains. The roadmap becomes an exercise in doing the old stuff much better, using modern technologies as a lever to deliver great speed, efficiency and reliability.
Closing note
This series will continue by quantifying the fragility problem and showing where complexity and friction creep in – then turning that understanding into a practical prioritisation plan. In Article 2 – Complexity, Friction, and the Outage Problem – we’ll explore a structured way to visualise complexity across OSS/BSS. We’ll also set up the case for simplification, CX and UX as the real innovation.